

In today’s competitive marketplace, standing out is more critical than ever. Every detail of your brand matters—from your logo to your tagline, colors, and typography. A personalized font can be a game-changer, giving your business a unique identity that resonates with your audience. Handwrytten, with its AI technology that mimics authentic handwriting, offers a unique way to elevate your brand by incorporating handwritten-style personalized fonts into your communication strategy.
Here’s how personalized fonts can make your brand more recognizable, create a lasting impression, and ensure your business stands out.
Typography is more than just the words on a page; it’s a visual representation of your brand’s personality. The font you choose can communicate professionalism, creativity, elegance, or playfulness. A personalized font adds an extra layer of distinction, making your brand instantly recognizable and memorable.
When used consistently across your marketing materials, personalized fonts can:
Personalized fonts create a unique visual language for your brand. When customers see your font, they immediately associate it with your business. This type of instant recognition is invaluable, especially in crowded industries.
Example: A bakery could use a handwritten-style font that mimics a flourished signature to evoke warmth and a personal touch. When customers see this font on packaging, ads, or social media, they immediately think of the cozy, handmade quality of the bakery’s goods.
Fonts have the power to convey emotions and set the tone for how your brand is perceived. A bold, modern font may communicate innovation and confidence, while a whimsical, handwritten font can express creativity and approachability.
Example: A children’s toy brand could use a playful, colorful handwritten font to convey fun and imagination. Meanwhile, a high-end fashion brand might opt for an elegant cursive font to exude sophistication and luxury.
Using a personalized font ensures that all of your brand’s materials—from business cards to social media graphics—have a cohesive and professional look. Consistency helps build trust and familiarity, which are key to fostering customer loyalty.
Example: A tech startup could use the same personalized font for its logo, website headers, and email signatures. Over time, this consistency helps establish the startup’s identity and makes it easily recognizable in a competitive market.
In an era where many businesses rely on generic templates and stock fonts, a personalized font helps your brand rise above the noise. It shows that you’ve taken the extra step to create something unique and tailored to your business.
Example: A real estate agent could use a handwritten font to make their marketing materials feel personal and approachable, helping them stand out from competitors who rely on standard typefaces.
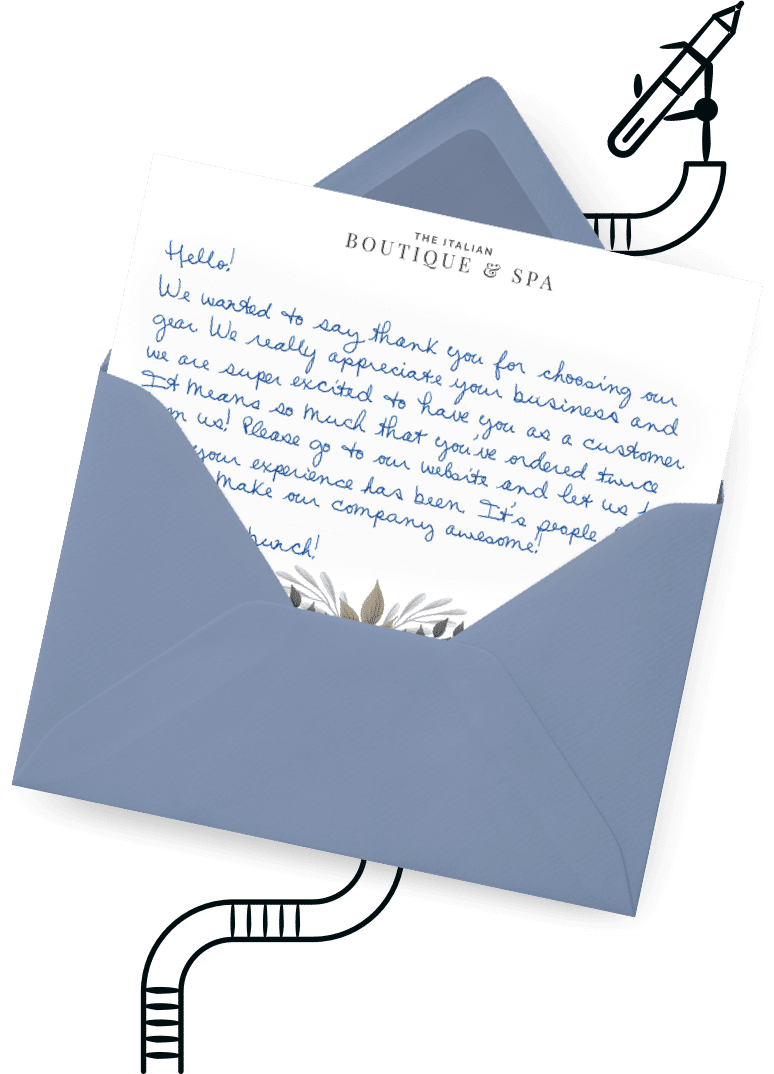
Handwritten fonts evoke a sense of authenticity and warmth. They remind customers of personal letters or notes, making your communication feel more intimate and genuine.
Example: A nonprofit organization could use a handwritten-style font in their thank-you letters to donors, making the message feel heartfelt and personal.
A personalized font can make your logo one-of-a-kind. The font becomes an integral part of your brand identity, representing your company wherever it appears.
Example: A coffee shop could create a logo with a script-style font that mimics a handwritten signature, reinforcing the artisanal nature of their offerings.
Custom fonts on packaging can elevate your products and make them more appealing to customers.
Example: A skincare brand could use a soft, handwritten font on its product labels to emphasize natural and gentle ingredients.
Typography plays a significant role in web design. Using a personalized font for headers, navigation menus, or calls-to-action can make your website more engaging.
Example: A wedding planner could use a cursive handwritten font for their website’s headings to create a romantic and elegant vibe.
From business cards to brochures, personalized fonts can help your marketing materials stand out and leave a lasting impression.
Example: A boutique hotel could use a personalized font on their brochures and welcome cards to give guests a sense of exclusivity and charm.
Typography is a powerful tool for grabbing attention on social media. A custom font can make your posts more visually appealing and reinforce your brand identity.
Example: A fitness brand could use a bold, energetic handwritten font for motivational quotes on Instagram, creating a cohesive and inspiring aesthetic.
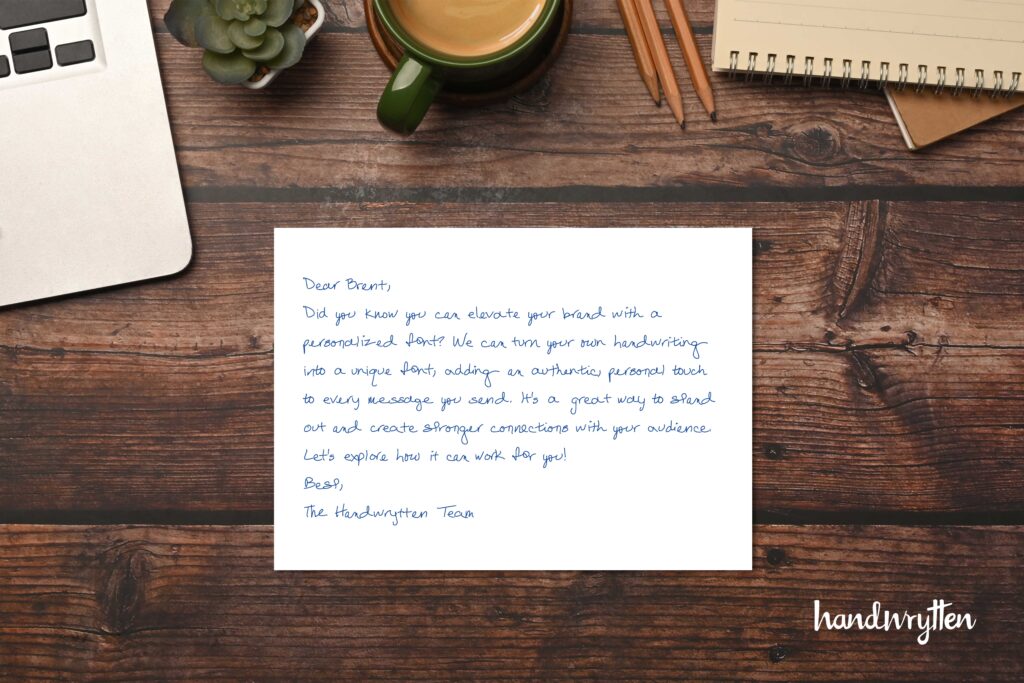
Handwrytten offers an innovative way to incorporate personalized, handwritten fonts into your brand strategy. Their AI technology mimics authentic handwriting, allowing you to create:
The process is simple: type your message, or let Handwrytten’s AI perfect it, then select from a variety of beautifully designed cards or create your own stationery. Handwrytten takes care of printing, packaging, and mailing, so you can focus on growing your brand.
A: Yes! Handwrytten can work with you to develop a personalized font that aligns with your brand’s style and values.
A: Consistently use your personalized font across all materials, including your logo, website, packaging, and marketing collateral. This creates a unified and recognizable brand identity.
A: Absolutely! Personalized fonts can be used for both digital assets, such as social media posts and websites, and print materials, such as business cards and packaging.
A: Yes! Whether you’re a small business or a large corporation, Handwrytten’s technology can accommodate your branding needs.
A: Any industry can benefit, but brands in fashion, hospitality, food and beverage, real estate, and creative services often see significant value in using personalized fonts.
Elevate your brand and leave a lasting impression with Handwrytten’s personalized fonts and handwritten-style cards. Whether you’re creating a unique logo, designing packaging, or sending heartfelt messages, Handwrytten’s AI-powered technology ensures your brand stands out with authenticity and style.
Visit Handwrytten today to discover how personalized fonts can transform your branding and make your business unforgettable!

Scale your handwritten outreach, creating positive impressions and long lasting bond.
Sign Up Today!

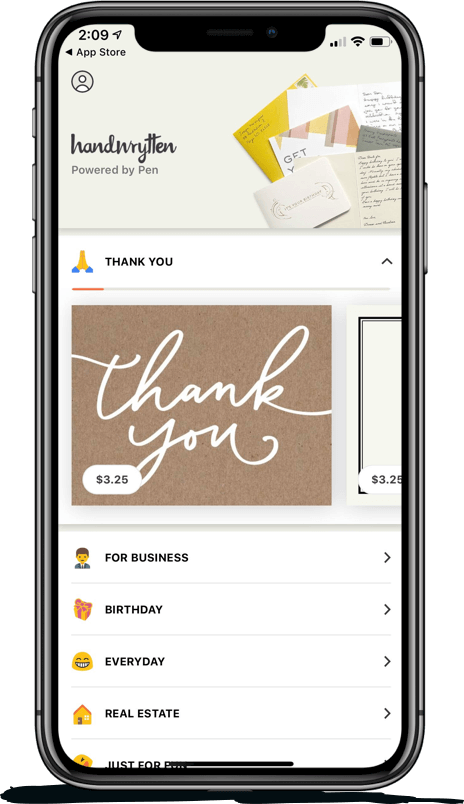
Over 100 designs to choose from or design your own. Our online card customizer makes it simple.
Check Out Our Cards!


Thank you.
